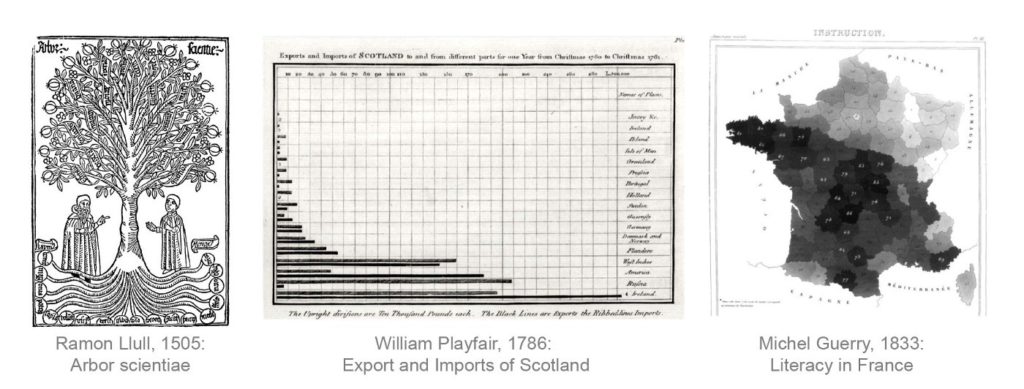
Throughout the history of data visualizations, we find amazing representations that we believe are actually modern inventions. These include:
This leads us to the question: If we already knew complex visualizations in the 1800s, why did they not become widely accepted? To answer this question, I have visually examined data visualizations.
Data visualizations as development process
Data visualizations can generally only be understood in the interplay of science, culture, and technology. Technical innovations have always helped shape cultures and societies (1, 2).
Especially the change of means of communication is a key element. The history of data visualization is mostly described on the basis of Western cultural circles and can therefore not be generalized without further ado (3, 4). Although visual representations have been used for a long time, the scientific examination of them is relatively young. In order to develop data visualizations, an understanding of how to store information with visual signs first had to be established. This also required a social approach to visual representations. Technical inventions made it possible to measure, record and document phenomena. In the further course, the concept of “objectivity” developed as a form of supposedly neutral representation.
Data
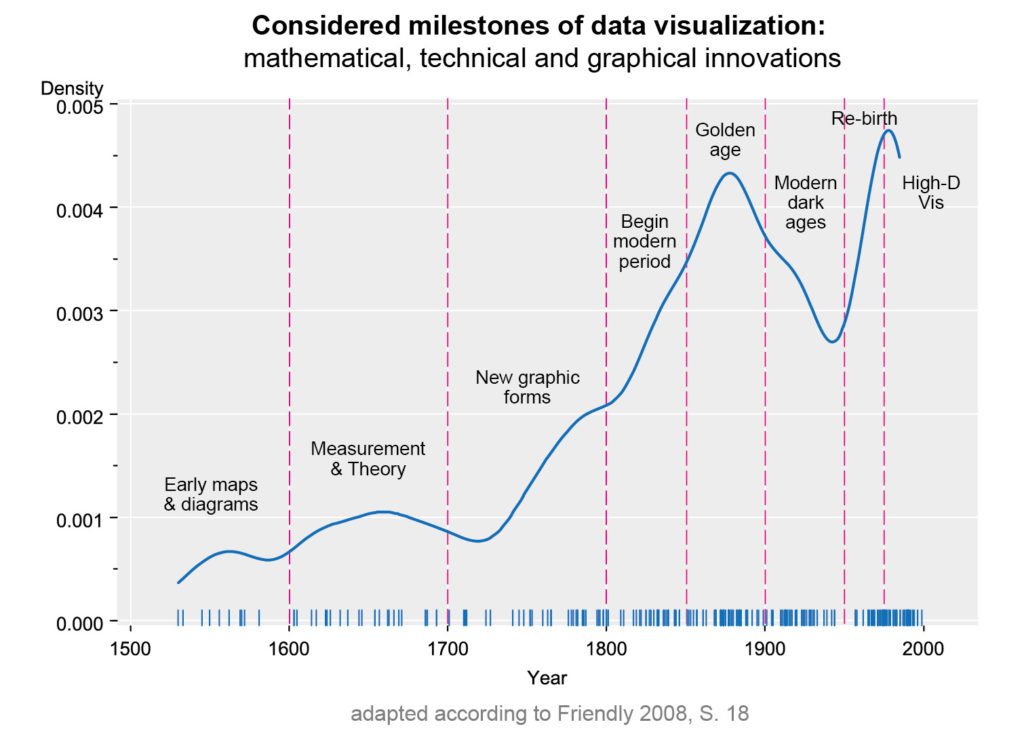
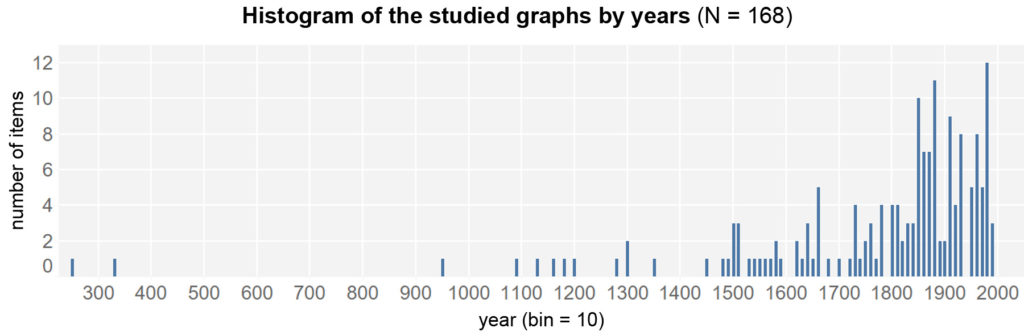
Innovative data visualizations that are considered “milestones” were used for the study. These graphics were selected on the assumption that they each presented the highest technical and graphical level at the time of their creation. The study by Friendly and Denis (2001) on the history of data visualization serves as orientation. These milestones include works by William Playfair, Florence Nightingale or Charles Minard. In this respect, the sample is based on a deliberate selection of the units of analysis (feature-specific-representative). The selection of graphs was supplemented by evidence from other studies. The final list includes 168 representations, from 250 to 1998.
The chart shows the technical and visual milestones collected by Friendly over time. A clear increase in inventions can be seen after 1850 and after 1950.
Collecting criteria
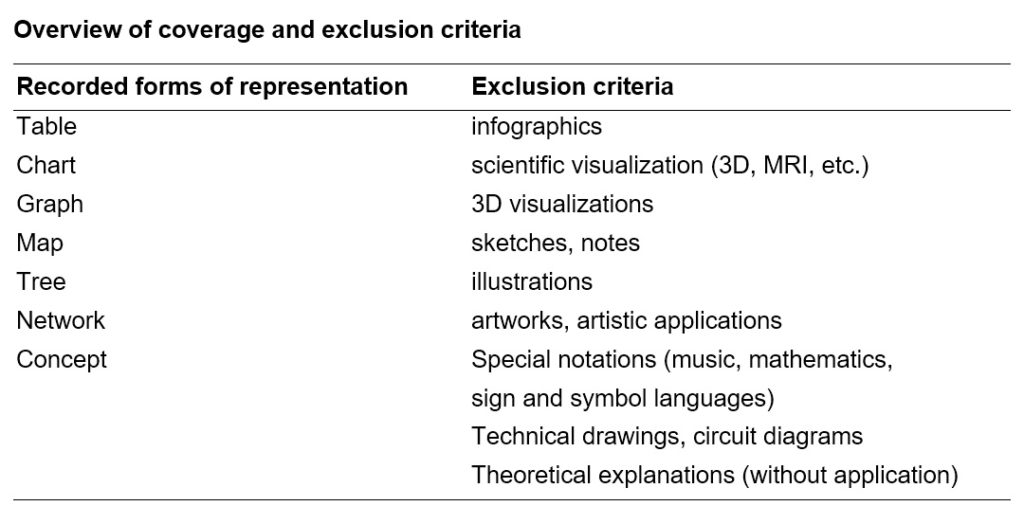
From the studies, only graphics that fit the object of investigation were recorded. The definitions of Börner (5) were used to categorize the types of visualization. Furthermore, the survey only extends to 1998 because that is where the coverage of “milestones” ends and there is no comparable canon for modern graphics. In addition, the number of visualizations is increasing very strongly, which is linked to the emergence of new graphics programs and analysis tools.
Method
A quantitative visual content analysis is used as the method. The quality level of the measurement is checked by the intercoder reliability according to Holsti. To analyze the data visualizations, we examined how data are translated into visual representations. These can be divided into three areas:
1) Visual complexity
2) Visual data representation and chart type.
3) Visual context
Visual Complexity
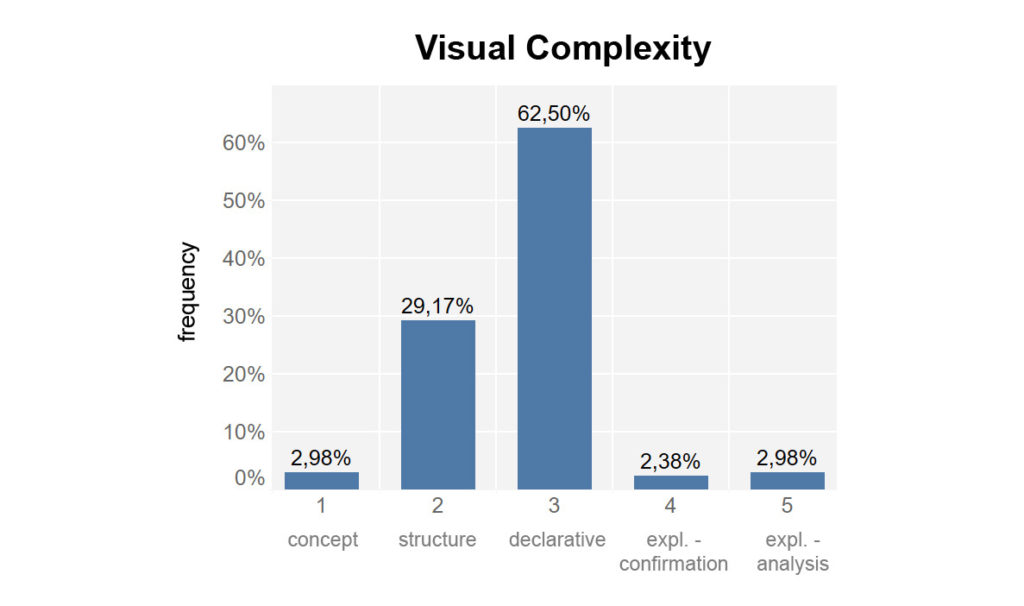
The degrees of visual complexity are assessed using a five-point scale. Data visualizations are categorized according to whether they range from a purely conceptual representation (1 = low complexity) to an exploratory analysis (5 = highest complexity). As the level of complexity increases, the relationship to data changes. While the first two levels only show structures or hierarchies, the third level (declarative representation) already requires a translation of data into visual features. This can be done, for example, by representing points in a coordinate system.
Chart type
In order to map the acquisition as completely as possible, the type of visualization is noted in the second category: Table, Chart, Graph, Map, Network, Tree or Concept (8).
Visual marker
Visual characters that are used to visualize the data are recorded. These range from points, lines, areas to texts, numbers, special characters, images, icons and statistical glyphs. Building on this are “visual variables” that relate to the properties of the symbols: Position, Shape, Color and Texture. The theoretical foundation is based on the framework of Börner (9).
Visual context
Here it is collected whether the representation makes use of visual metaphors or accompanying illustrations. For categorization, the art-scientific thesaurus Iconclass is used (10).
Procedure
The various charts and graphs were analyzed using a coding sheet. To check intercoder reliability, the plots were edited by two coders. Overall, the instrument performed well with a Holsti coefficient of .93 (11).
Statistical evaluation
Cluster analysis is used to identify structures. In this way, objects of investigation are combined into groups that are as similar as possible in terms of their characteristic values. At the same time, the different groups should have hardly any similarities to each other (12, 13). The similarity measure is calculated by means of Jaccard coefficient (14).
The dendrogram (average linkage) shows the grouping of the examined documents into larger groups. Six clusters can be identified. Since the data contain many very different aspects, a conservative merging procedure was chosen, which neither tends to form groups of equal size nor to generate many outliers (15, 16).
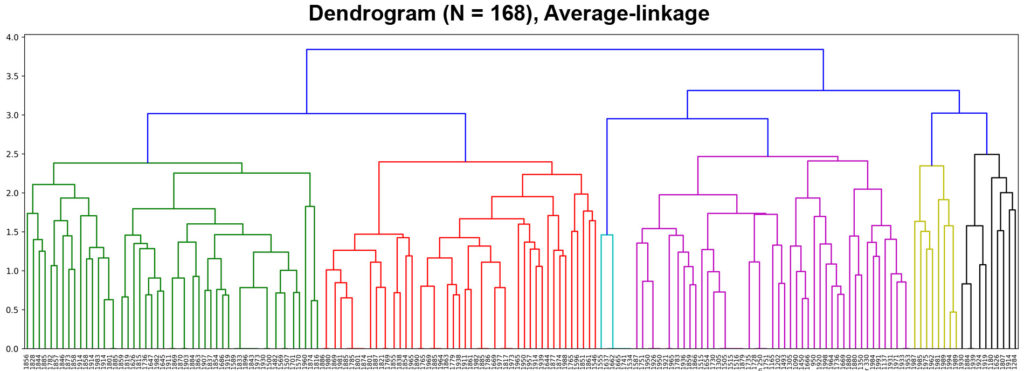
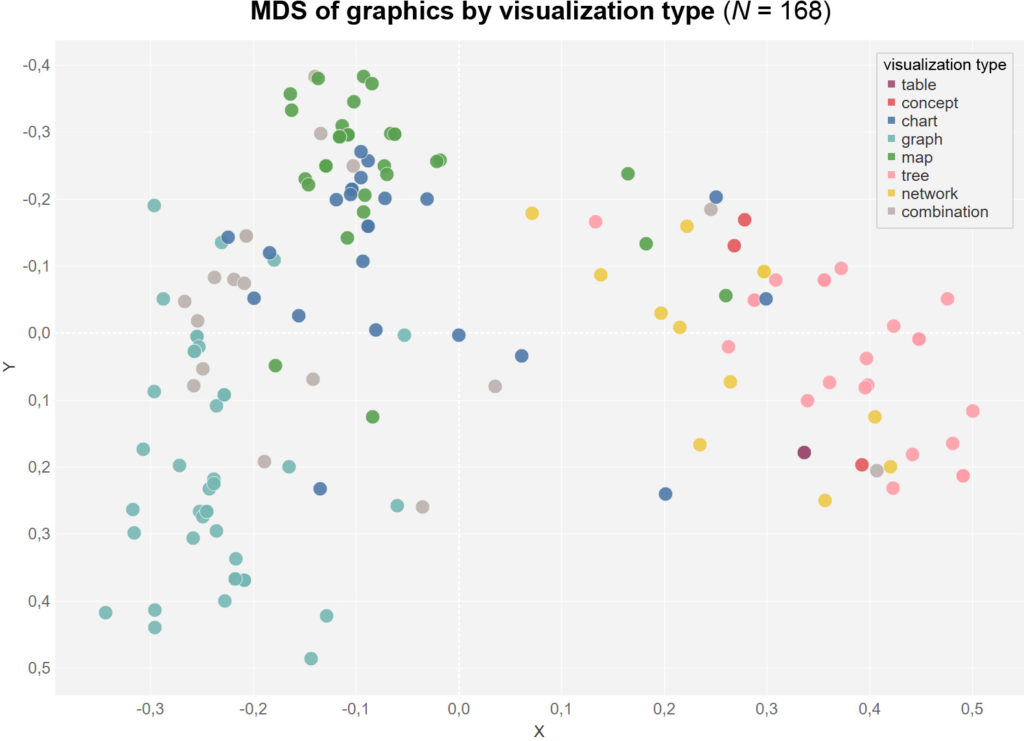
For the visual representation of the clusters, the distance measures are displayed using MDS (Multidimensional Scaling). The MDS is suitable because it reflects the similarities and differences of the individual documents to each other comprehensibly (17, 18).
Results: Social conventions as factors for usage
The analysis is intended to explore exploratively which patterns can be found and which insights can be derived from them for today’s use. Besides known factors like mathematical or metrological inventions, it becomes apparent that especially social conventions play a central role. Practices of communication and the acceptance and understanding about visualization are central.
The graphs examined cover the period from 250 to 1998. The frequencies increase especially towards the end of the 19th century. The median of the data distribution is in 1859 (M = 1772.7; SD = 260.6).
Visual complexity
The visual complexity indicates the level of representation achieved by a graphic. The distribution of the values shows that the majority is accounted for by structural and declarative representations, such as charts with coordinate axes. The technically and visually more demanding graphics (explorative) account for only 5.4% of the data. These include representations with complex visual symbols or network diagrams.
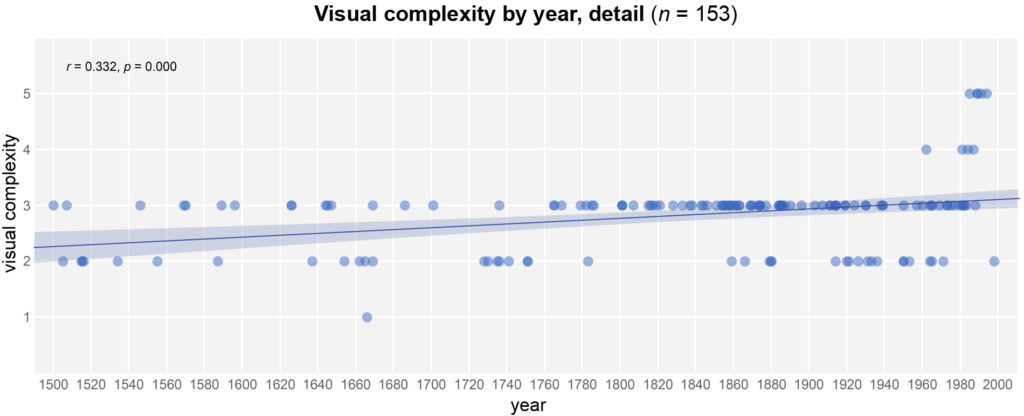
Visual complexity over time
The development was steady for a long time, with maps in particular being the focus. In the period from 1500 to 2000, the increase in declarative representations can be traced clearly. At the same time, it becomes clear that data-based representations were used relatively early and over a long period of time. The greatest distinguishing feature from the 1970s onwards is the analysis of massive amounts of data as well as the increasingly computer-aided graphical processing.
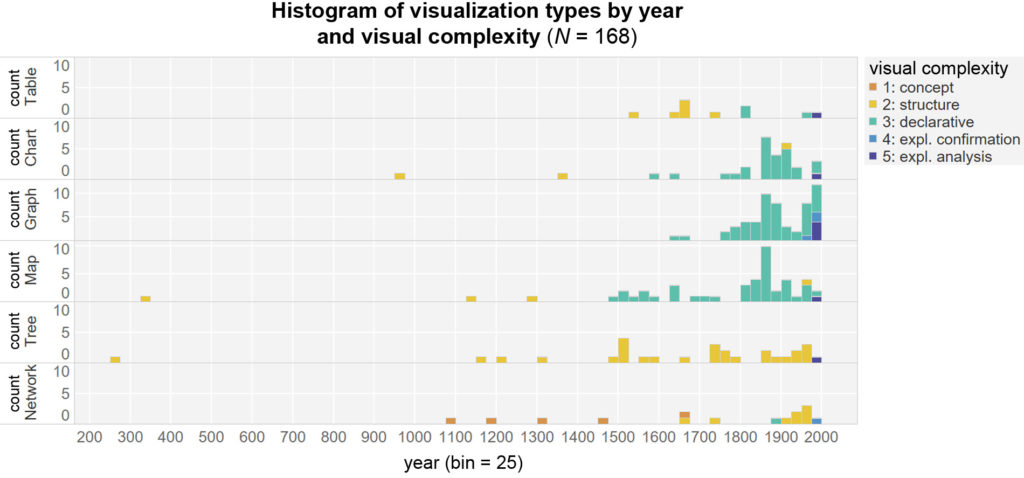
Types of visualization in the course of time
The first visualization form to reach the declarative level is maps. The increase in charts and graphs from 1850 onwards is also evident. The highest levels of complexity do not appear until the middle and end of the 20th century.
Visual context
The representations were often supplemented by visual metaphors or allegories, especially in earlier times. This is increasingly evident in maps and decision trees in the form of illustrations. However, such contextualizations are also increasingly found in charts at the beginning of the 20th century.
Common appearance of forms of representation
If we examine the visual markers and symbols used (dot, line, shape, color, etc.) for their common occurrence (cooccurrence), certain characteristics emerge. Over the centuries, visual markers evolve along with their visualization types.
While maps and decision trees with few visual variables dominate in the 16th century, charts and graphs are already much more common in the 18th century. In the 19th century, it is noticeable that there is a clear focus on charts, graphs and maps within the declarative complexity level. Finally, in the 20th century, all complexity levels are represented. In addition, the individual visualization types are relatively balanced in terms of visual variables and symbols.
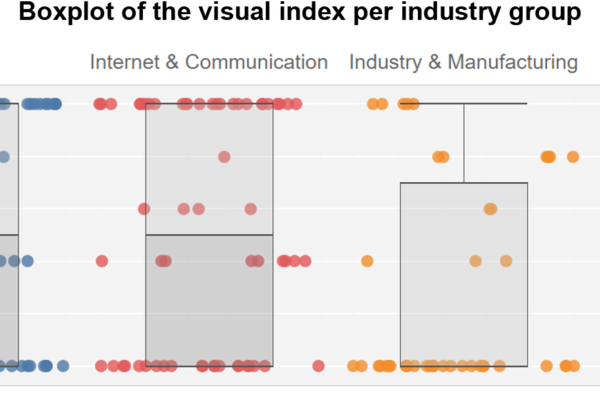
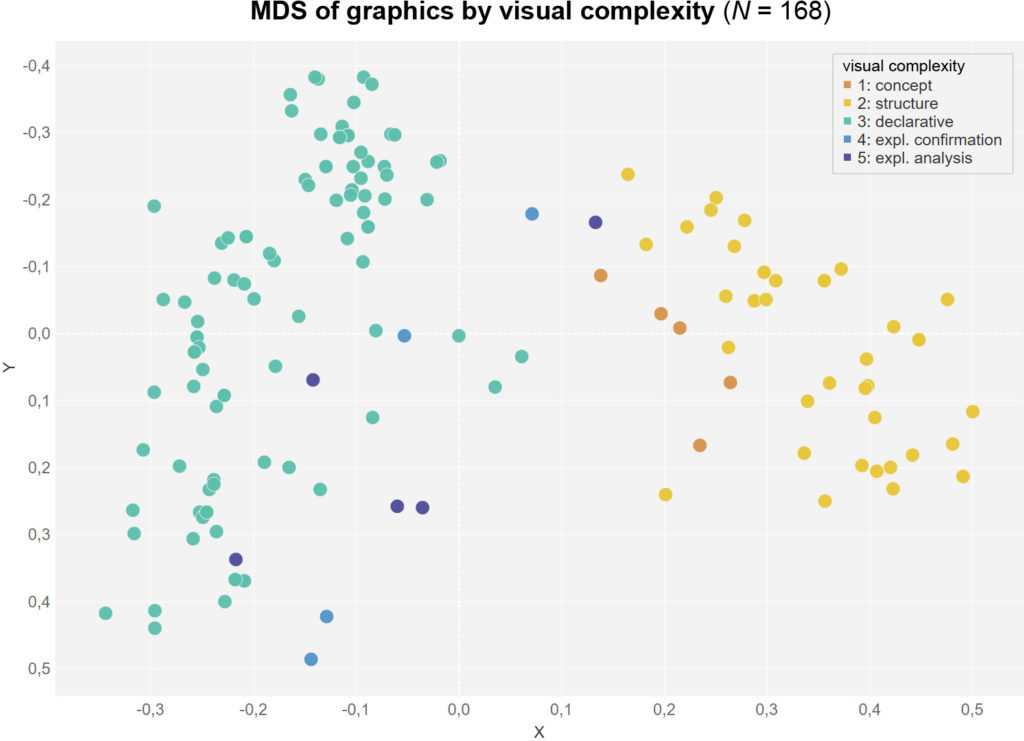
Cluster: Analysis of all characteristics
The three largest groups (clusters 1, 2 and 4) are clearly visible on the dot diagram. Overall, there is a juxtaposition between the left and right sides, which differ the most. If the clusters are evaluated on the basis of their F and t values, the following characteristics can be identified:
• Cluster 0: Charts with visual context: pictograms and icons
• Cluster 1: network and tree graphs with low visual complexity
• Cluster 2: Graphs with medium visual complexity
• Cluster 3: Modern graphs with highest visual complexity
• Cluster 4: Maps and charts with medium visual complexity
• Cluster 5: Tables with ordering function
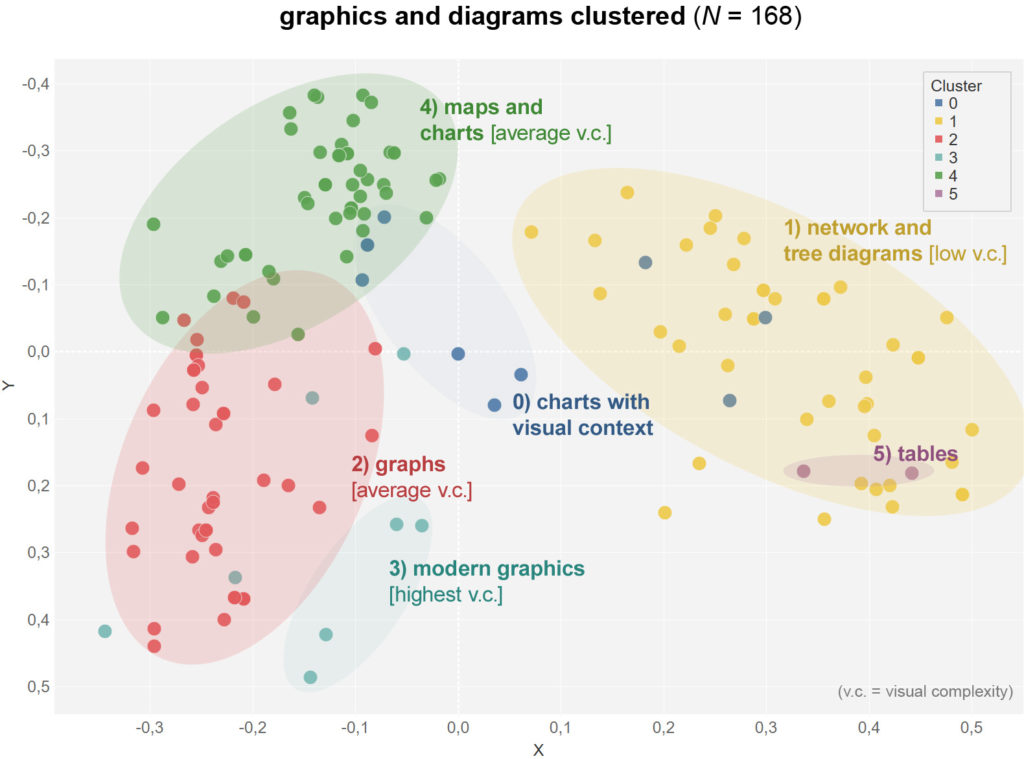
Since the representation is based on a MDS, the distances are significant in terms of content and indicate the similarity or difference of the groups and points to each other. Regarding the time of origin, the clusters are differentiated into modern graphics on the left and older ones on the right.
Thus, clusters 1 and 5 form the groups with the oldest works. At the same time, they mainly contain visualization types with tree diagrams and network representations. On the left, graphs, charts and maps tend to form independent clusters.
Accordingly, visual complexity is also distributed relatively clearly between low values (1-2) on the right and higher values (3-5) on the left.
Insights
It is noticeable that data visualizations, despite their relatively early achievement of high levels of visual encoding, have not found widespread application. Reasons include high reproduction costs, limited color choices, and limitations in duplication. However, a significant obstacle has been the distrust of visualizations due to their ambiguity.
In order for data visualizations to gain acceptance, visual and social conventions first had to develop (19). However, this required a change in culture, society and everyday life (20, 21). This is because communication processes require a communally shared system of signs, which depends on the respective socio-cultural system (22). Political, social and cultural fields of a society therefore also shape the communication systems.
Another finding is that visual context plays a special role. There are many representations in early times that accompany content with visual metaphors, such as illustrative representations on decision trees or maps. However, these visual contextualizations do not immediately disappear in modern times. It can be found in the context of pictograms, for example. Presumably, infographics can be understood as a modern variant of this visual contextualization. Content is made more accessible through visual storytelling.
What can we expect in the future?
The results suggest that data visualizations are increasingly used as a new visual approach. Increasing use may also lead to pressure to adapt, resulting in standardization of data visualizations, up to and including new conventions (4). By extension, visualizations can form a new access to information. In this form, they can help shape prevailing symbol systems in a society (5). In European history, we saw the social effects through the standardization of writing by means of letterpress printing, which led to new feedback dynamics in the exchange of opinions and knowledge (6, 7).
A greater use of data visualizations in everyday life and at work can have an impact on communication processes. The insight into the company fields showed that such techniques can increasingly be found in various fields of societies.
────
The article is based on my research about artificial intelligence as an enabler for data visualization automation (2021).
Footnotes
- Hepp 2016, S. 228
- Krotz 2017, S. 352, 355
- Krotz 2017, S. 357
- Friendly 2008, S. 16–17
- Börner 2015, S. 30-31
- Rössler 2017, S. 75
- Berinato 2016, S.58, 61-66; Koponen & Hilden 2019, S. 25, 27, 219, 223;
Börner 2015, S. 44; Masud et al. 2010, S. 448; Rehbein 2017, S.332;
Munzner 2015, S. 4-7 - Wilke 2019; Kirk 2019; Koponen & Hilden 2019; Berinato 2016
- Börner 2015, S. 28-39
- Brandhorst & Posthumus 2009, 2017
- Rössler 2017, S. 214–215
- König & Jäckle 2017, S. 54
- Backhaus et al. 2018, S. 437
- Backhaus et al. 2018, S. 442–443
- Backhaus et al. 2018, S. 440-441, 469-470
- König & Jäckle 2017, S. 57–58
- Backhaus et al. 2018, S. 589–590
- König 2017, S. 179–180
- Krotz, 2014, S. 155–156
- Hepp & Hasebrink, 2018, S. 17–18
- Krotz, 2017b, S. 353
- Godulla, 2017, S. 155–156
References
- Backhaus, Klaus; Erichson, Bernd; Plinke, Wulff; Weiber, Rolf (2018): Multivariate Analysemethoden. Eine anwendungsorientierte Einführung. 15. Aufl. Berlin: Springer Gabler.
- Beltekian, Diana; Ortiz-Ospina, Esteban (2018): Trade and Globalization. Trade from a historical perspective. Our World in Data. Online verfügbar unter https://ourworldindata.org/trade-and-globalization#trade-from-a-historical-perspective.
- Berinato, Scott (2016): Good charts. The HBR guide to making smarter, more persuasive data visualizations. Boston, Massachusetts: Harvard Business Review Press.
- Börner, Katy (2015): Atlas of knowledge. Anyone can map. Cambridge, Massachusetts: The MIT Press.
- Boyle, Edward (2018): Cartographic Exchange and Territorial Creation: Rewriting Northern Japan in the Eighteenth and Nineteenth Centuries. In: Mirela Altić, Imre Josef Demhardt und Soetkin Vervust (Hg.): Dissemination of Cartographic Knowledge. 6th International Symposium of the ICA Commission on the History of Cartography, 2016. Cham: Springer International Publishing (Lecture Notes in Geoinformation and Cartography), S. 75–98.
- Brandhorst, Hans; Posthumus, Etienne (2009): Contents of Iconclass. Online verfügbar unter http://www.iconclass.nl/contents-of-iconclass.
- Brandhorst, Hans; Posthumus, Etienne (2017): Iconclass: a key to collaboration in the digital humanities. In: Colum Hourihane (Hg.): Routledge companion to medieval iconography. New York: Routledge, S. 201–218.
- Cohen, Jacob (1992): A power primer. In: Psychological Bulletin 112 (1), S. 155–159. DOI: 10.1037/0033-2909.112.1.155.
- Friendly, Michael (2008): A Brief History of Data Visualization. In: Chun-houh Chen, Wolfgang Härdle und Antony Unwin (Hg.): Handbook of data visualization. Berlin: Springer, S. 15–56.
- Friendly, Michael; Denis, Daniel J. (2001): Milestones in the history of thematic cartography, statistical graphics, and data visualization. Online verfügbar unter http://www.datavis.ca/milestones/, zuletzt geprüft am 04.09.2020.
- Hepp, Andreas (2016): Kommunikations- und Medienwissenschaft in datengetriebenen Zeiten. In: Publizistik 61 (3), S. 225–246. DOI: 10.1007/s11616-016-0263-y.
- König, Pascal D. (2017): Multidimensionale Skalierung (MDS). In: Sebastian Jäckle (Hg.): Neue Trends in den Sozialwissenschaften. Wiesbaden: Springer, S. 177–202.
- Kirk, A. (2019). Data visualisation: A handbook for data driven design (2nd edition). SAGE.
- König, Pascal D.; Jäckle, Sebastian (2017): Clusteranalyse. In: Sebastian Jäckle (Hg.): Neue Trends in den Sozialwissenschaften. Wiesbaden: Springer, S. 51–84.
- Koponen, Juuso; Hildén, Jonatan (2019): Data visualization handbook. First edition. Aalto: Aalto University (Art + Design + Architecture, 1).
- Krotz, Friedrich (2017): Pfade der Mediatisierung: Bedingungsgeflechte für die Transformationen von Medien, Alltag, Kultur und Gesellschaft. In: Friedrich Krotz, Cathrin Despotović und Merle-Marie Kruse (Hg.): Mediatisierung als Metaprozess. Transformationen, Formen der Entwicklung und die Generierung von Neuem. Wiesbaden: Springer VS (Medien – Kultur – Kommunikation), S. 347–364.
- Masud, Luca; Valsecchi, Francesca; Ciuccarelli, Paolo; Ricci, Donato; Caviglia, Giorgio (2010): From Data to Knowledge – Visualizations as Transformation Processes within the Data-Information-Knowledge Continuum. In: 2010 14th International Conference Information Visualisation. 14th International Conference Information Visualisation (IV). London, TBD, United Kingdom: IEEE, S. 445–449.
- Munzner, Tamara (2015): Visualization analysis & design. Boca Raton, FL: CRC Press.
- Rehbein, Malte (2017): Informationsvisualisierung. In: Fotis Jannidis, Hubertus Kohle und Malte Rehbein (Hg.): Digital Humanities. Eine Einführung. Stuttgart: J.B. Metzler, S. 328–342.
- Rössler, Patrick (2017): Inhaltsanalyse. 3. Aufl. Konstanz, München: UTB.
- Sakakibara, Sayoko (2019): Localizing Asia: Mapping Japan, Asia, and Europe in the Early Modern World. In: Martijn Storms, Mario Cams, Imre Josef Demhardt und Ferjan Ormeling (Hg.): Mapping Asia: Cartographic Encounters Between East and West. Cham: Springer International Publishing, S. 109–124.
- Simonova-Gudzenko, Ekaterina (2019): Gyōki-Type Shape: Representation of the Japanese Archipelago in East-Asian and Western Maps. In: Martijn Storms, Mario Cams, Imre Josef Demhardt und Ferjan Ormeling (Hg.): Mapping Asia: Cartographic Encounters Between East and West. Cham: Springer International Publishing, S. 125–145.
- Wilke, C. O. (2019). Fundamentals of Data Visualization. O’Reilly Media.