design analysis and framework
deep decorum
When design is generated in seconds,
decision–making becomes even more important.
Design becomes visible and understandable with the help of data analytics. Graphs provide a common denominator for teams and stakeholders. Research and design processes can thus be sped up.
Application in the design process
the concept of decorum
“decorum” is a ancient communication principle which describes the appropriateness of a message for its intended purpose and context
explanation
Given the example, Peak-B and Peak-C might be a well established design stereotype or cliché. Out of fear of missing the right tone with the audience, these stereotypes are not challenged.
By exploring the whole solution space we may find an even better fitting global maximum: Peak-A.
Design challenges
- Design has to convey communication goals in an appealing way
- visual conventions (fonts, imagery, shapes) do not remain stable, but change with trends
- design changes depending on cultural, social and technological developments
Solution for better design processes
- Design framework: helps to plan and define design more precisely
- Visual analysis: enables a comprehensive competitor analysis and current trends as data visualization
How does the application look like?
These three examples show how design processes can be improved through the framework and visual analytics.
Case: University Branding
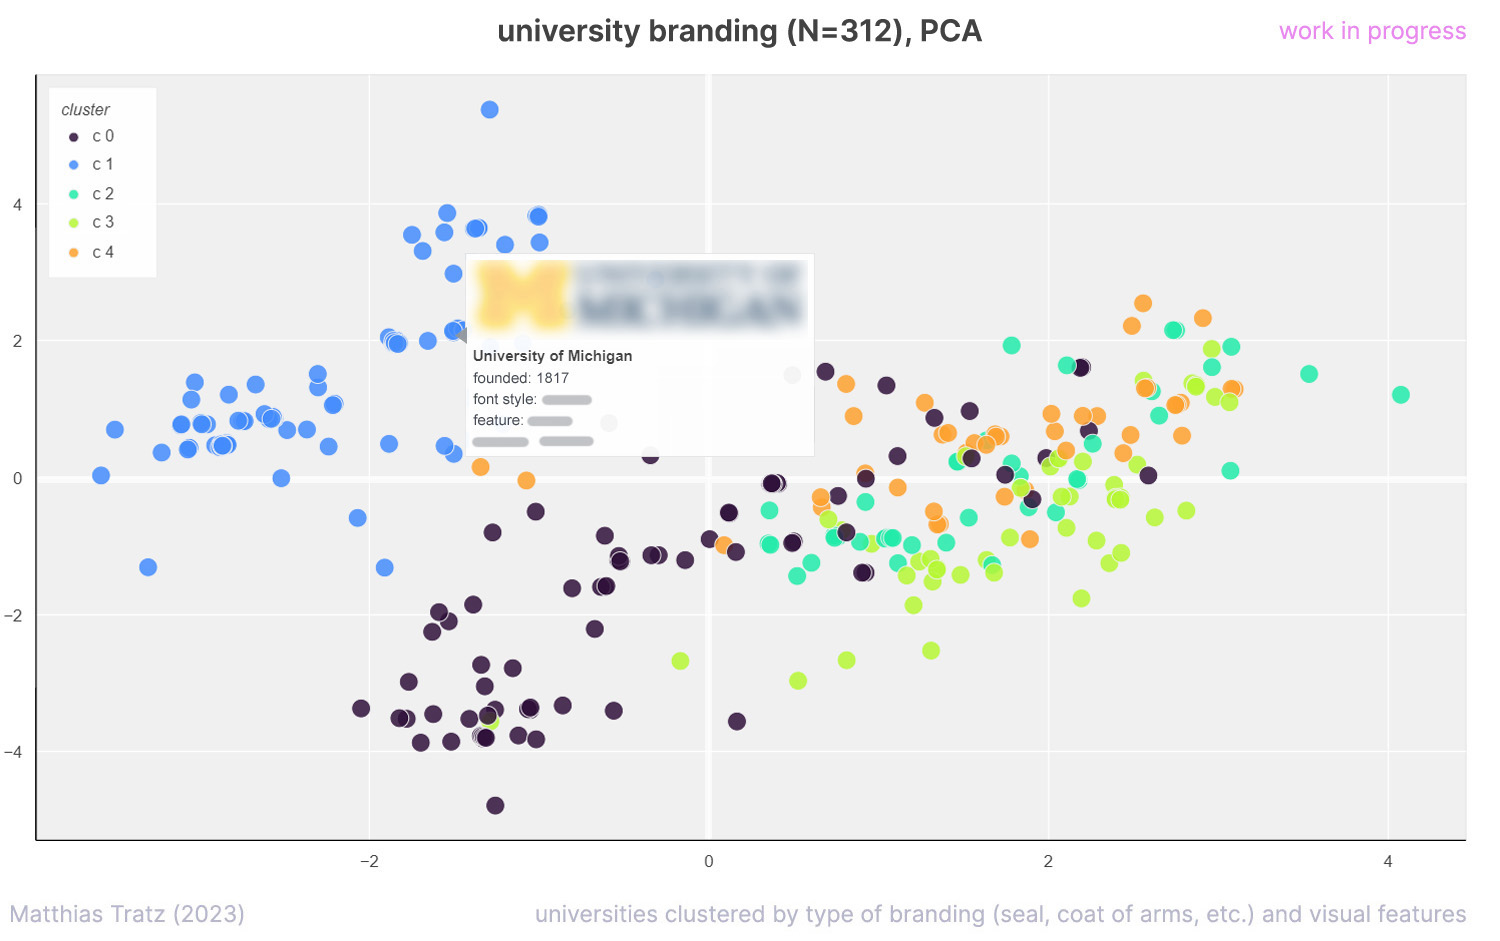
University logos were visually analyzed in terms of their type (word mark, seal, coat of arms, etc.) as well as other attributes. The top 1000 universities in the world serve as the data basis (QS Ranking, 2019).
The graphs use conventional representation variants of statistics (PCA, UMAP, MDS).
Advantage of the analysis
- faster and more comprehensive competitor analysis
- Precise starting points for positioning
- faster development of mood boards
- designs with better target audience relevance
What types of logos do universities use to communicate?
- the logos of universities can be globally divided into three groups: Coat of arms, seals, modern trademarks
- differences between France, USA, Italy become clear
Focus of analysis on USA, France and Italy
- in addition to the type of logo, other elements such as illustration style, motifs (buildings, people, etc.) were also included
- a hover over the data points shows the logo and collected characteristics
Insights
- the USA uses all logo variants
- significant differences between France and Italy
Understand market environment with its design patterns
- the data can be further broken down into clusters
- each cluster shares certain characteristics, the boundaries may be fluid
Insights – four quadrants:
- monogram logos: common in the USA in connection with college sports
- abstract logos: more common in France
- classical seals: traditional logos, especially in Italy
- figurative logos: logos representing architecture, symbols, etc.
Which characteristics distinguish a cluster?
- individual clusters can be assessed based on their typical features
- Cluster 1 (blue) is characterized by monogram and word mark logos
Making design tangible at the data level
Interactive visual mapping: at the touch of a button, data points can also be displayed as graphs
(for legal reasons the logos are blurred here)
Making differences and similarities comprehensible to outsiders
Narrow down the solution space for your design
The communication goals and findings from the visual analysis serve as constraints for the design. Visual exploration helps to avoid misunderstandings and inappropriate approaches from the beginning.
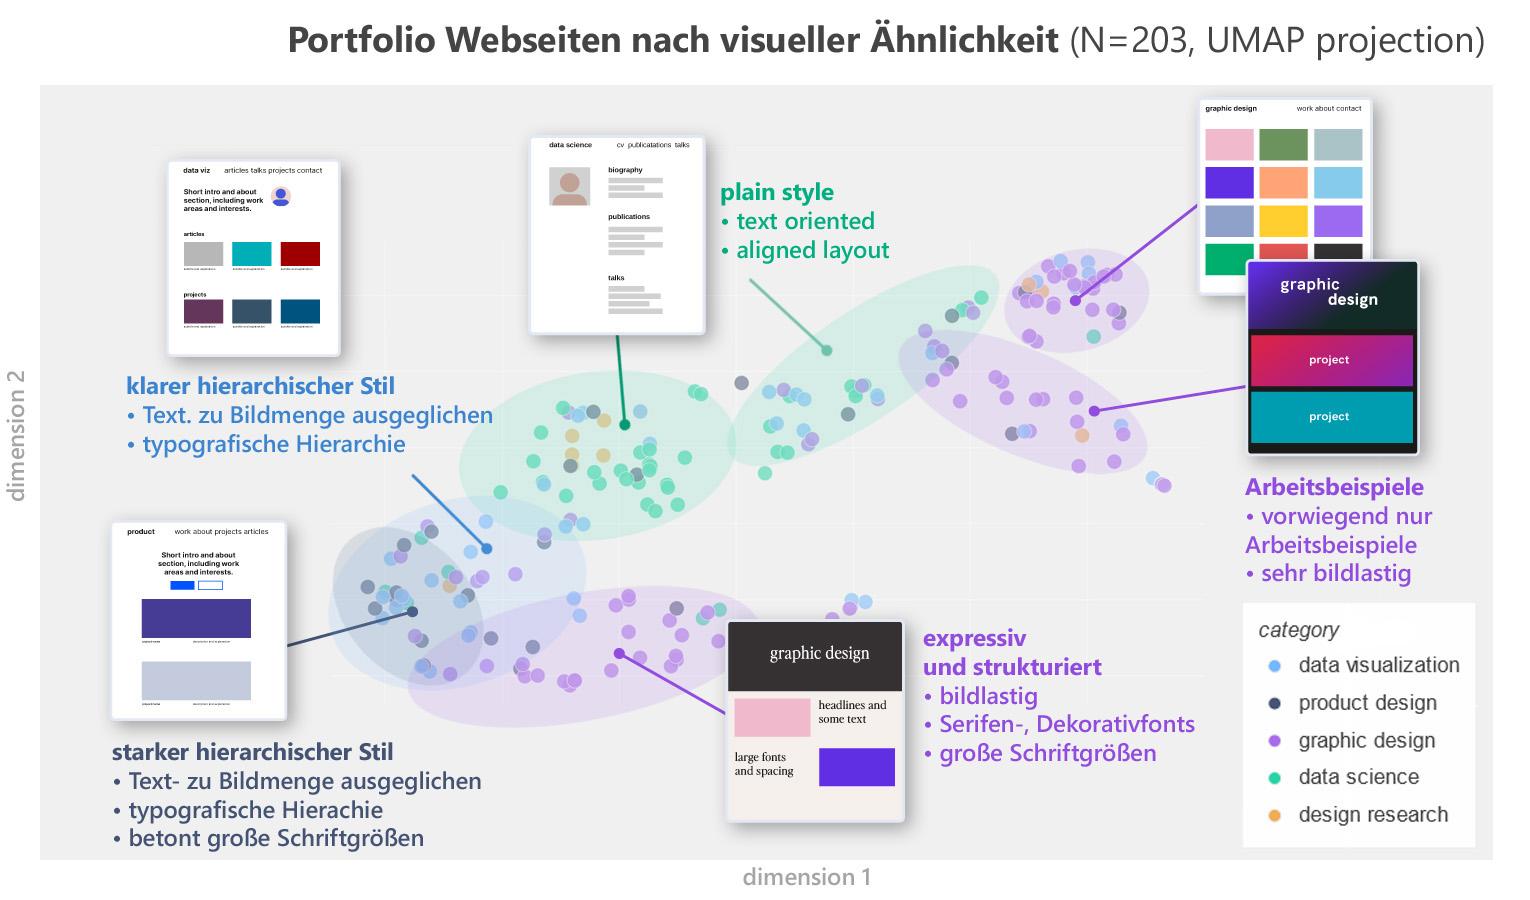
Case: Portfolio websites
To find the visual style for a portfolio website, the sites of 200 leading personalities from the design, DataViz and Data Science were examined. The analysis covers both visual and content aspects.