Which industries use data visualizations
as part of their service – and who is next?
Excerpt from research article
Excerpt from research article
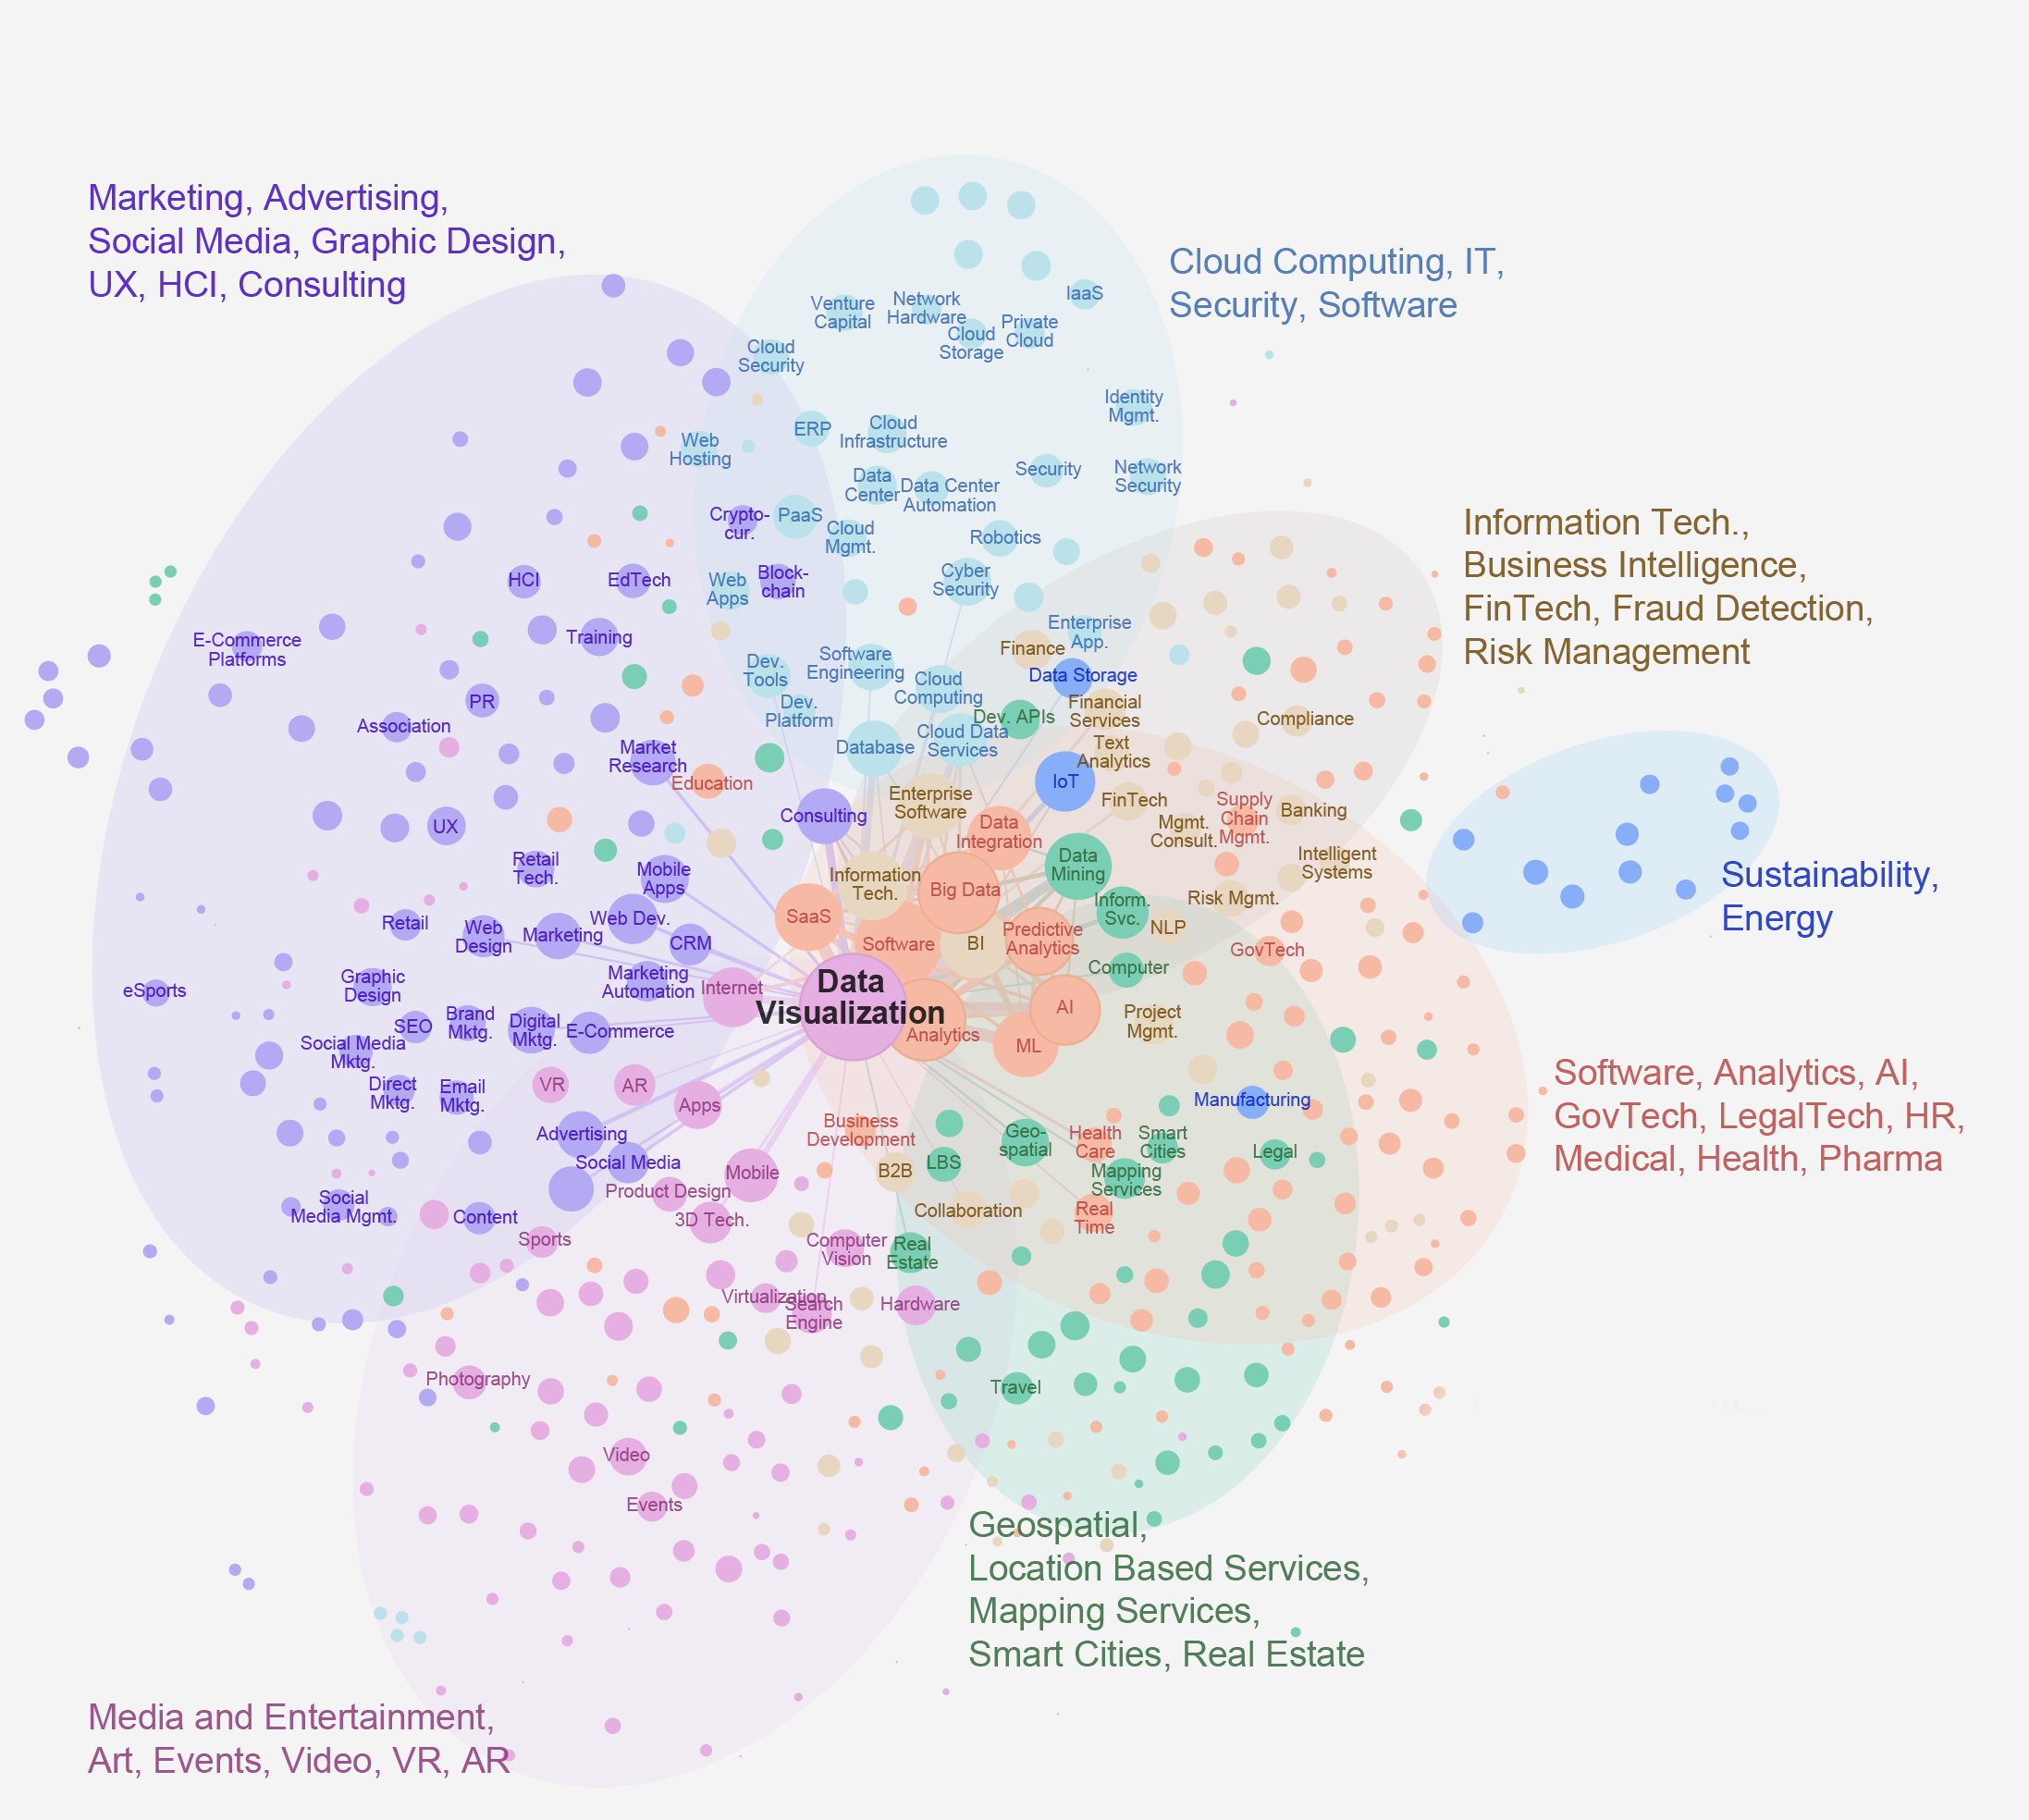
The network shows a variety of application areas of data visualizations, which can be roughly sorted into three societal fields:
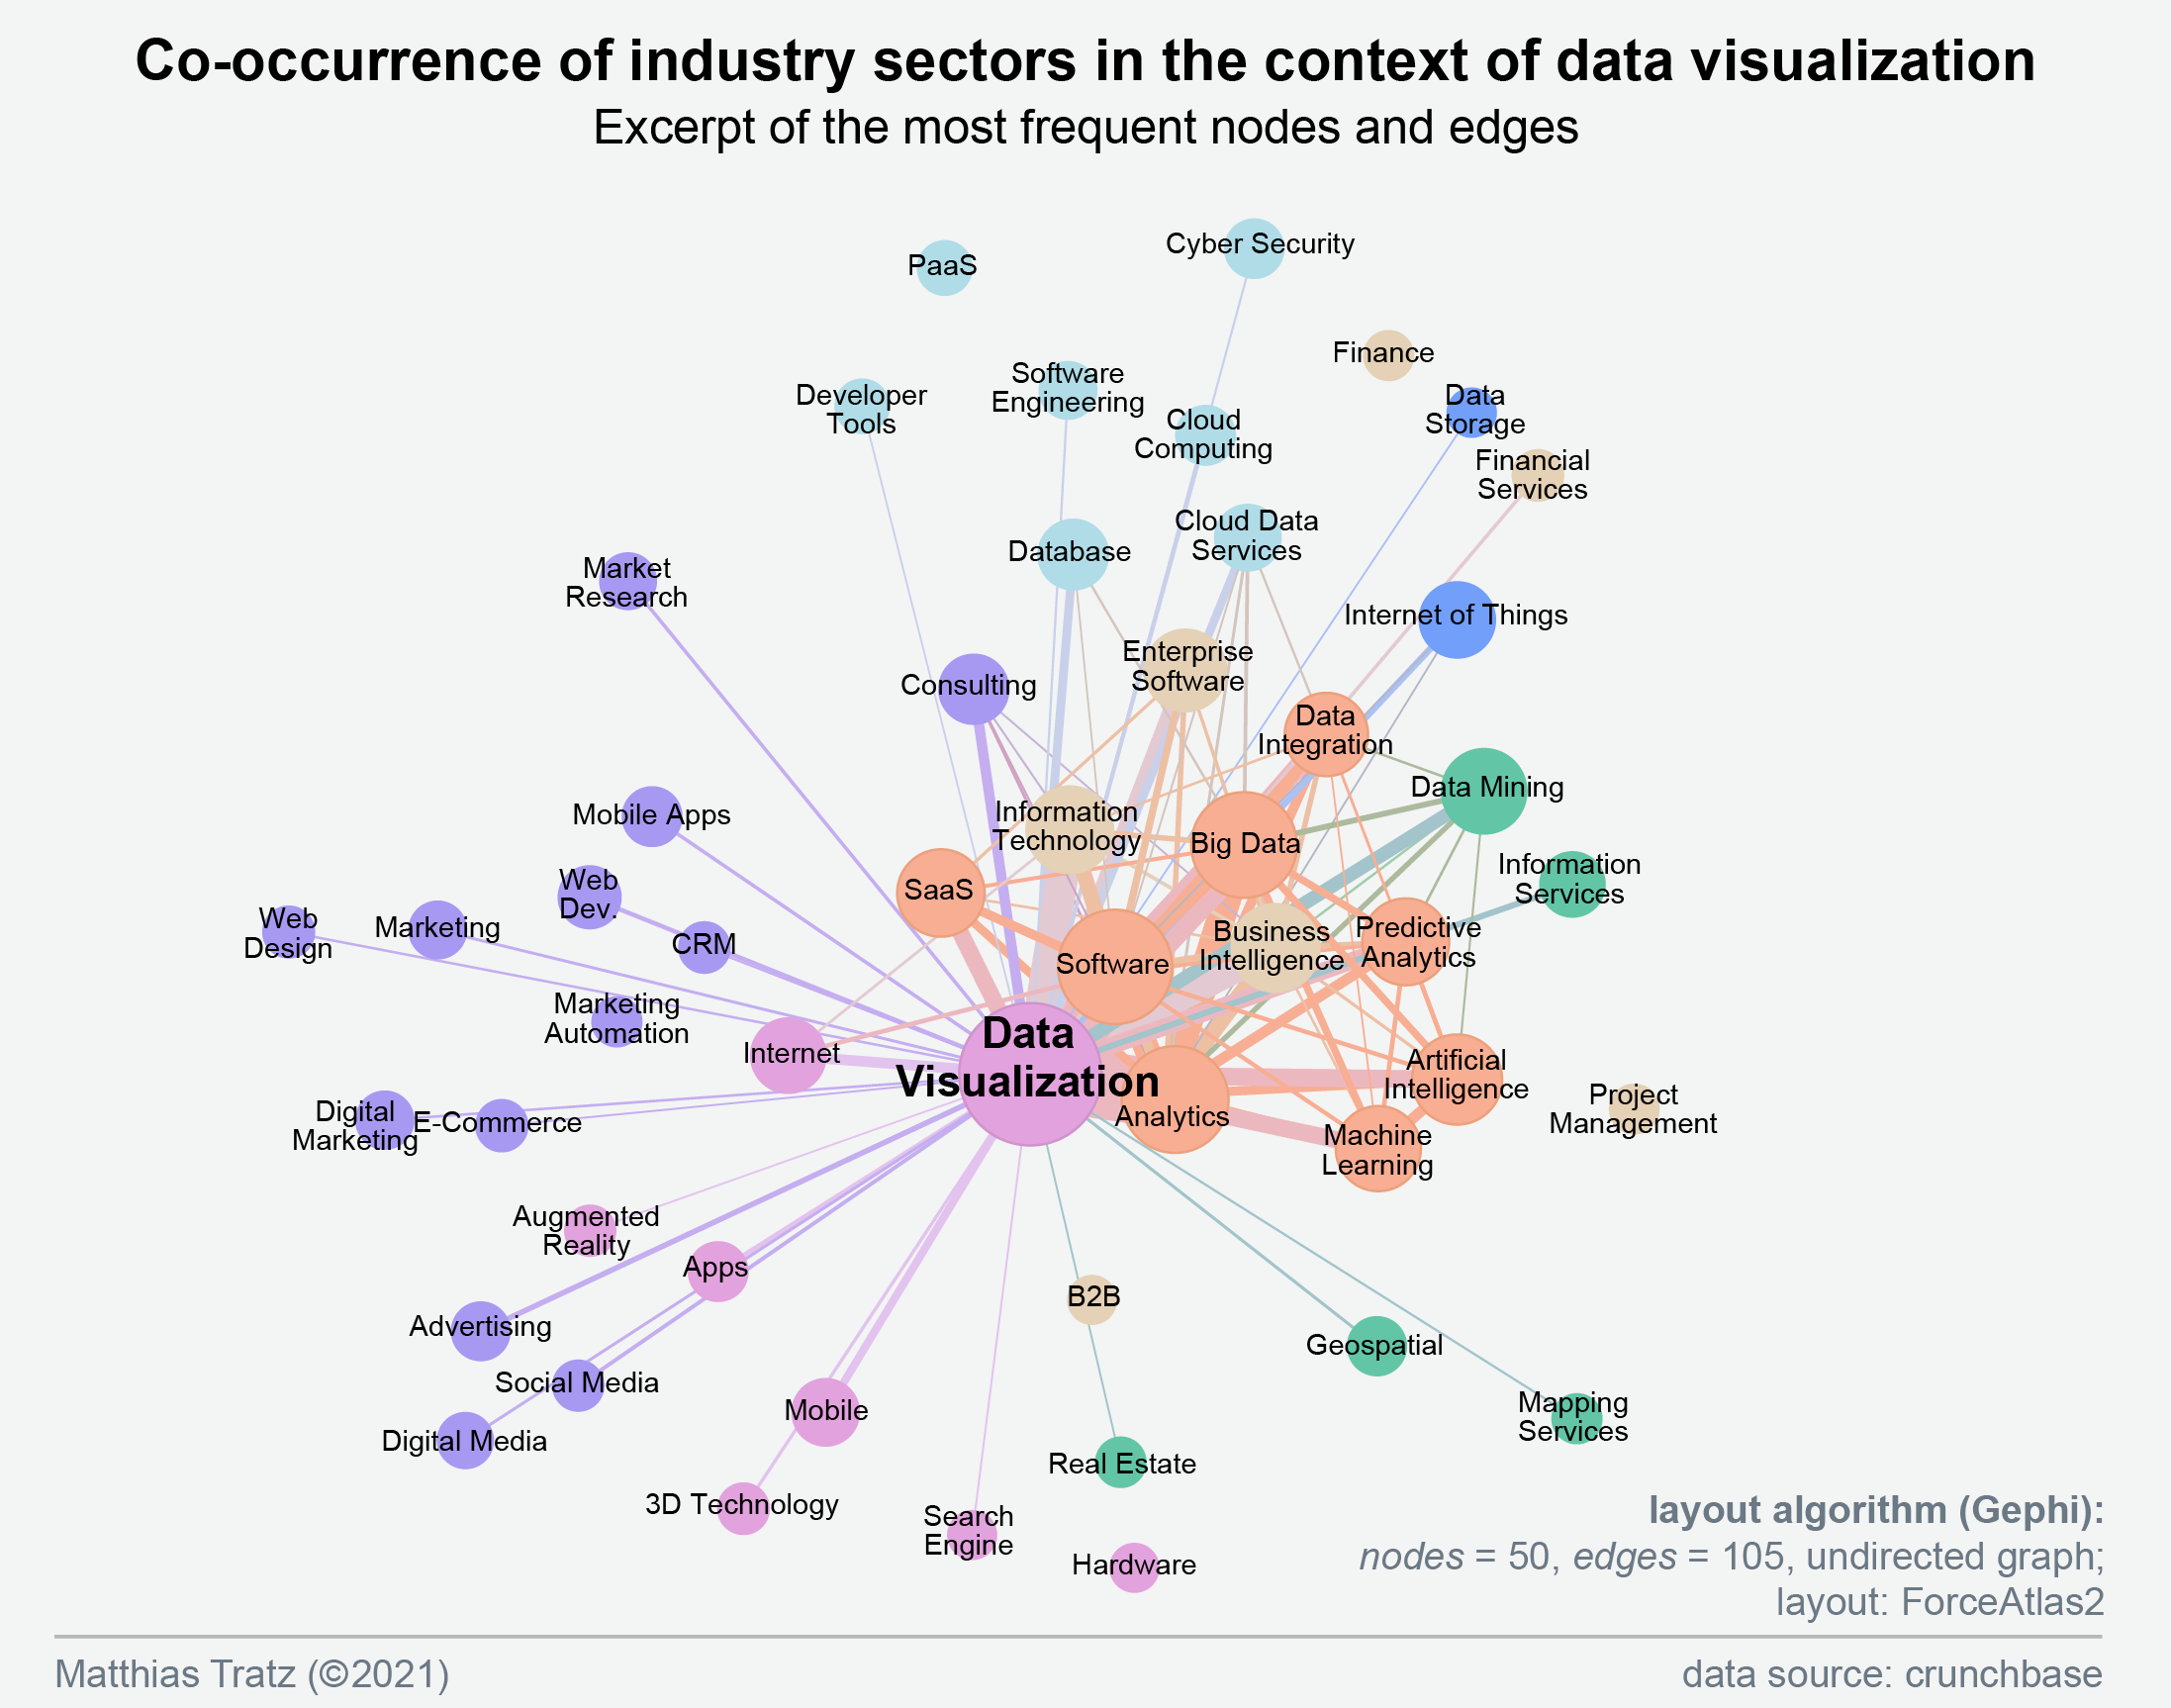
The graph clearly shows that data visualizations are particularly represented in technical areas: Analytics, Software, Big Data, SaaS, Business Intelligence, Data Integration, Machine Learning and Artificial Intelligence.
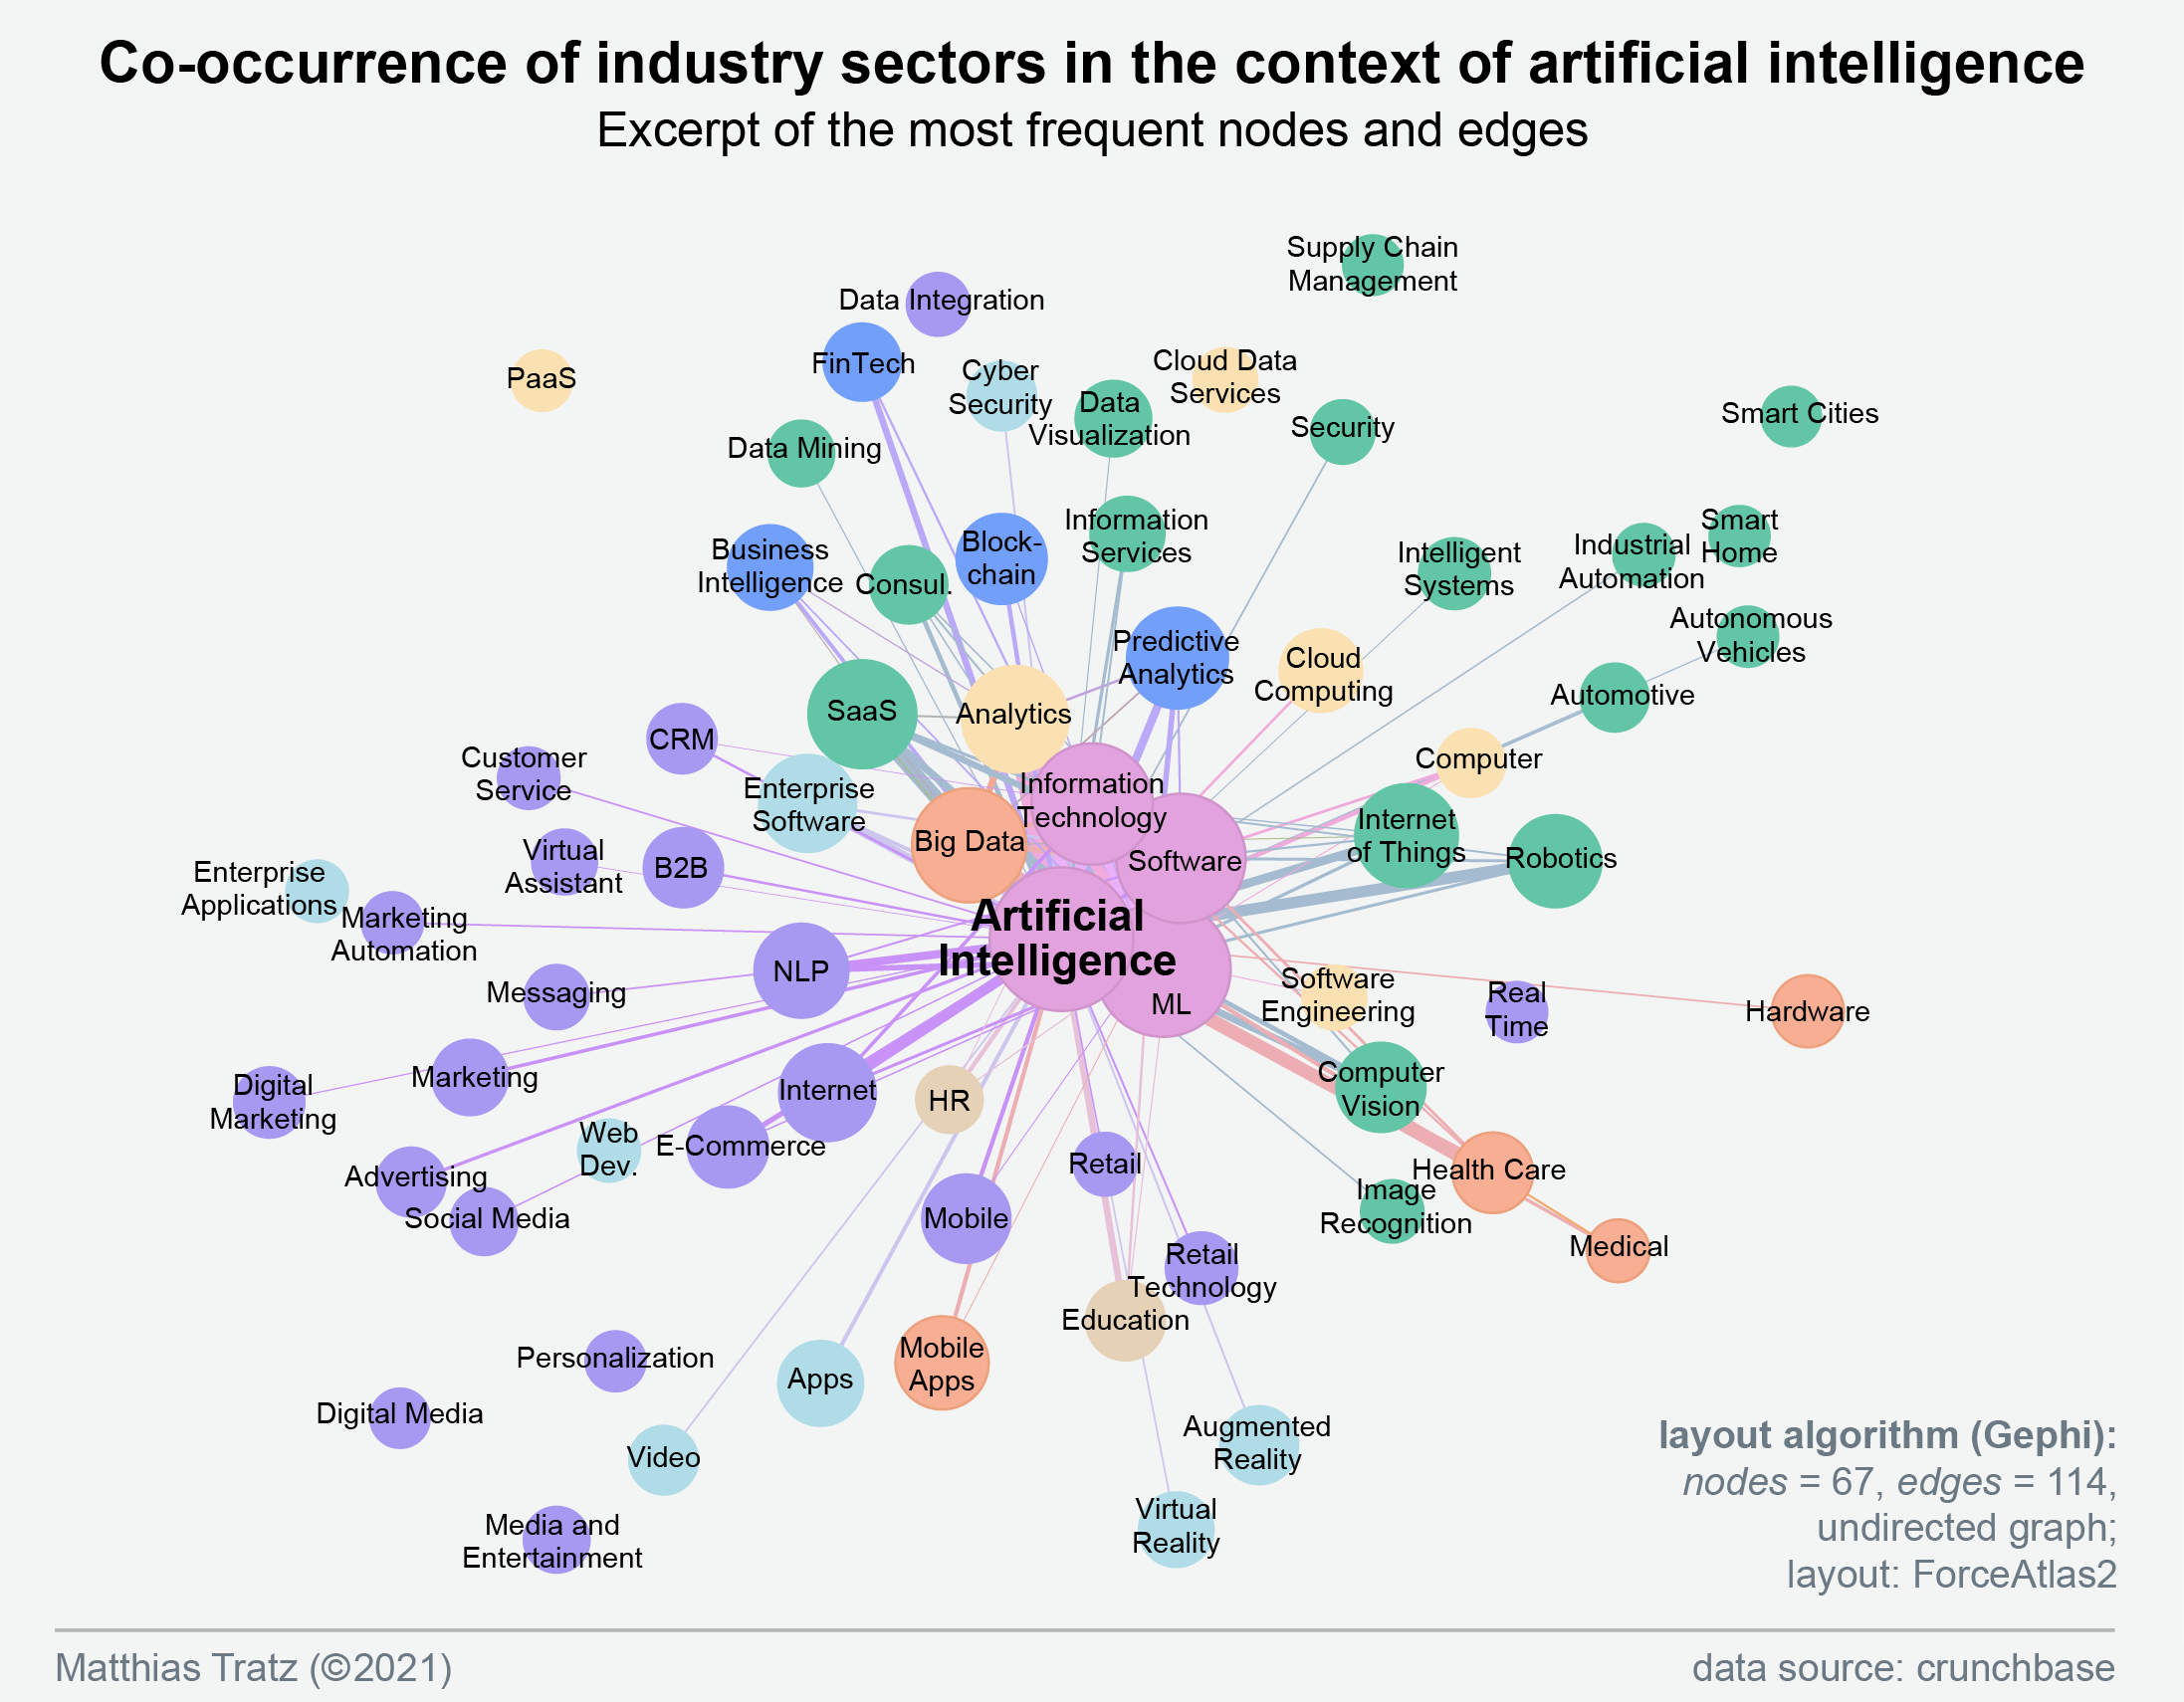
In the field of artificial intelligence, references to technical fields such as machine learning, software, big data, analytics, and AI analysis methods such as NLP, computer vision, and image recognition become clear. There are also strong connections to application areas such as SaaS (Software as a Service), Business Intelligence, Fintech, Health Care, and Medical.